India, the world’s largest democracy, is set to hit the polls in less than three weeks to elect its next government. An estimated 96.9 crore voters are registered to vote in the upcoming general elections with the poll season lasting 44 days.
Over the years India’s general elections have seen various trends in terms of percentage participation of voters and their demographic as well as region-wise trends. Outlook India looks at how voting trends have evolved with time.
Growing size of electorate and voter participation over the years
Since the very first general election in India in 1951-52, the size of the electorate and the voter turnout has shown a consistent upward trend. In 1951 India had 17.32 crore registered voters and 45.67 per cent had turned up to vote to elect the first government in independent India. In 1957, the number of registered voters went up to 19.37 crore and 47.74 per cent turnout was recorded.
Over the years, a consistent rise has been observed in number of people coming out to exercise their voting rights with about 66 per cent in 2014 Lok Sabha elections and 67 per cent of the 91.2 crore registered voters in 2019, which has been India’s biggest election so far.
New records are expected to be set in 2024, with 96.88 crore registered voters, forming the world's largest electorate.
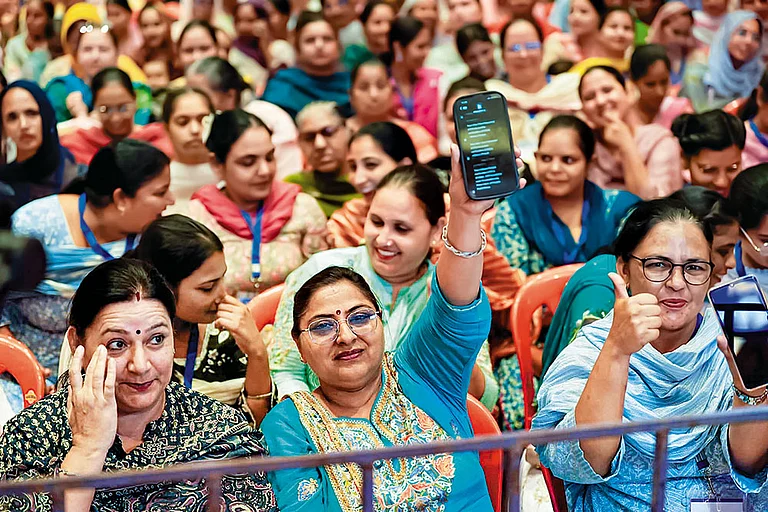
Female voters
In 1957 general elections, women’s voting percentage was 39 per cent compared to 56 per cent of men. Out of the total voters, men have been the dominant gender accounting for a higher percentage of voters. In 1962, of the total electorate, men accounted for 52.7 and women 47.3 per cent of the vote share and a similar percentage has been recorded in the subsequent years. In 2009, 52.2 per cent men and 47.8 per cent women, in 2014 it was 52.4 per cent men and 47.5 per cent women, and in 2019 of the total votes, 51.9 per cent were by males and 48.08 per cent by females.


.jpg?auto=format%2Ccompress&fit=max&format=webp&w=768&dpr=1.0)
However, 2019 elections were historic for women voters as for the first time in seven decades female participation exceeded male participation. Out of the total registered female voters, 67.18 per cent voted. For males the percentage was 67.01 per cent.
Rural and Urban constituencies
According to a study conducted by Centre for the Study of Developing Societies (CSDS), a clear trend has been observed over the decades of lower turnout in urban constituencies and higher turnout in rural constituencies. The study noted that big metropolitan cities registered much lower turnout not only compared to small towns but also compared to the average national turnout in elections at both national and state levels.
In 1996, rural areas had a 60 per cent turnout, while urban areas had 51 per cent, the national average was 58 per cent. And continuing on the same trajectory, in 2019, rural areas recorded a 68 per cent turnout, and urban areas had 60 per cent, with the national average being 67 per cent.
Academic Sanjay Kumar says the low turnout in urban constituencies can be attributed to the “overall disenchantment of the urban middle class and urban upper class with politics”.
State-wise turnout
Lakshadweep island recorded the highest voter participation in the previous general elections of 2019 at 85 per cent. It was followed by the northeastern state of Nagaland at 83 per cent, Manipur at 82.69, Tripura at 82.4 and Arunachal Pradesh at 82.11. The northeastern states in general recorded a high voter turnout.
The southern states also saw high voter participation with Andhra Pradesh at 80.38 per cent, Kerala at 77.84 per cent, Tamil Nadu at 72.46, Karnataka at 68.81. Telangana recorded a percentage lower than the national average with only 62.77 per cent voter turnout.
The electorally important state of Uttar Pradesh which sends the most number of MPs (80) to the Lok Sabha, recorded a voter turnout of only 59.21 per cent. Bihar was at 57.33 per cent.
Earlier this month, as part of its 'Turnout Implementation Plan' (TIP), the Election Commission shortlisted 10 constituencies in Uttar Pradesh where the voter turnout was lower than the State's polling percentage. These parliamentary constituencies included Phulpur (48.57 per cent), Kanpur (51.39 per cent), Allahabad (51.75 per cent), Shravasti (52.05 per cent), Gonda (52.11 per cent), Domariyaganj (52.26 per cent), Pratapgarh (53.36 per cent, Bhadohi (53.45 per cent), Amethi (54.05 per cent) and Sant Kabir Nagar (54.15 per cent), according to PTI.
"This time, a Turnout Implementation Plan has been made and constituencies and booths where polling has been low have been shortlisted," Chief Election Commissioner Rajiv Kumar had said.
"Now, why the voting has been less there, the [district] collectors will personally go there and see. They will try to convince, appeal and request them [voters] to participate in democracy [elections].”