| Coverage (per cent) | Availability (hours*) | Consumption (Ltr/capita)* | Demand (million ltr)* | Supply (million ltr)* | |
| Calcutta | 66 | 10 | 209 | 1,125 | 1,125 |
| Chennai | 97 | 4 | 80 | 600 | 400 |
| Delhi | 86 | 4 | 200 | 3,600 | 2,925 |
| Mumbai | 100 | 5 | 178 | 3,200 | 2,700 |
| Bangalore | 70 | 2. 5 | 105 | 970 | 680 |
| * per day Source: Asian Development Bank report, 1997 | |||||
Thirsting For The Blue Diamond
Published at:


Thirsting For The Blue Diamond
Thirsting For The Blue Diamond

- Previous Story
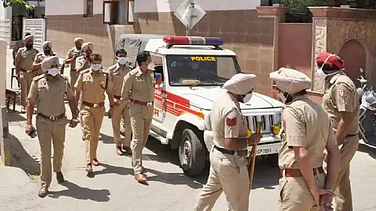
 Punjab Police Draws Criticism For Imposing Rs 80 Fees On FIR Downloads
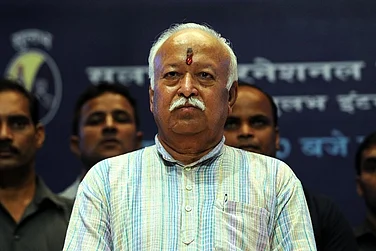
 - Next StoryMohan Bhagwat Flags Illegal Immigration, Calls for Three-Child Policy
WATCH


MORE FROM THE AUTHOR


PHOTOS


, World Cup Play-offs: Shootout Win Breaks Irish Hearts In Prague")
×