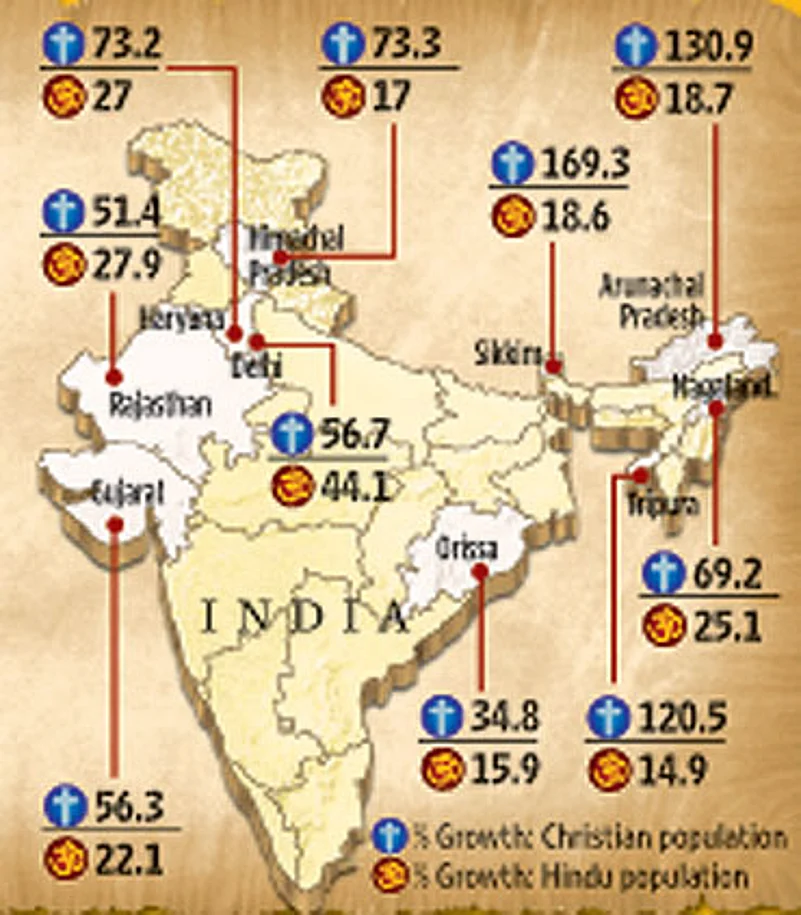
Figuratively Speaking
Percentage growth in population between 1991 and 2001 as per Census
These statistics, giving the percentage growth of population groups, describe a wide variety of situations on the ground. Juxtaposing these figures with the actual population base of these groups—and their proportion vis-a-vis the total—helps clarify this.
For instance, in Arunachal Pradesh, the 130.9% increase in Christian population accounts for an increase from 89,013 in 1991 to 2.05 lakh in 2001 (as the overall population rose from 8.64 lakh to 10.97 lakh). But in Himachal Pradesh, the 73.3% increase describes a growth from 4,435 to 7,687 (in a total population that went from 51 lakh to 60lakh).
| Hindu | Christians | Overall | |
| Andhra Pradesh | 14.4 | -2.8 | 14.5 |
| Arunachal Pradesh | 18.7 | 130.9 | 26.9 |
| Assam | 14.9 | 32.5 | 18.9 |
| Bihar* | 23.0 | 35.9 | 27.2 |
| Delhi | 44.1 | 56.7 | 47.0 |
| Goa | 17.2 | 3.0 | 15.2 |
| Gujarat | 22.1 | 56.3 | 22.6 |
| Haryana | 27.0 | 73.2 | 28.4 |
| Himachal Pradesh | 17.0 | 73.3 | 17.5 |
| Karnataka | 15.3 | 17.4 | 17.5 |
| Kerala | 7.3 | 7.8 | 9.4 |
| Madhya Pradesh* | 21.7 | 33.9 | 22.6 |
| Maharashtra | 21.6 | 19.6 | 22.7 |
| Manipur | -5.9 | 17.7 | 17.9 |
| Meghalaya | 18.3 | 42.1 | 30.6 |
| Mizoram | -9.3 | 30.7 | 28.8 |
| Nagaland | 25.1 | 69.2 | 64.5 |
| Orissa | 15.9 | 34.8 | 16.2 |
| Punjab | 28.7 | 30.0 | 20.1 |
| Rajasthan | 27.9 | 51.4 | 28.4 |
| Sikkim | 18.6 | 169.3 | 33.0 |
| Tamil Nadu | 11.0 | 19.0 | 11.7 |
| Tripura | 14.9 | 120.5 | 16.0 |
| Uttar Pradesh* | 24.2 | 20.1 | 25.5 |
| West Bengal | 14.2 | 34.3 | 17.7 |
| India | 20.3 | 22.6 | 22.6 |
| * Population figures for states created after 1991 census have been added to the states they were part of. The 1991 census was not conducted in Jammu & Kashmir. | |||