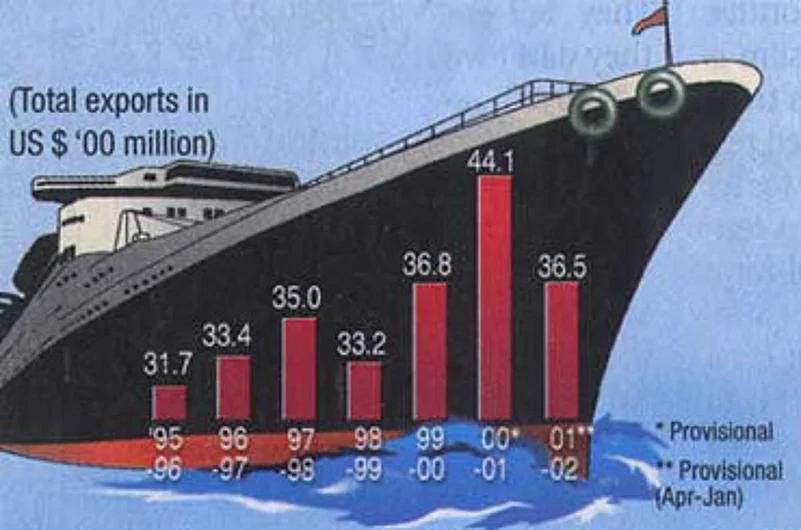
| Commodity-wise export growth (%) | 2000-01 | 2001-02 |
| Basmati Rice | 30.9 | -33.9 |
| Spices | -18.5 | -4.3 |
| Tea | -10.3 | -6.3 |
| Primary & semi-finished iron/steel | 88.0 | -30.1 |
| Computer software | 72.1 | -64.7 |
| Textile (excluding readymades) | 16.9 | -10.5 |
| Readymade garments | 25.6 | -15.5 |
| Gems and jewellery | 8.4 | -9.4 |
| Handicraft (Excl. handmade carpets) | 0.6 | -28.7 |
| ||


