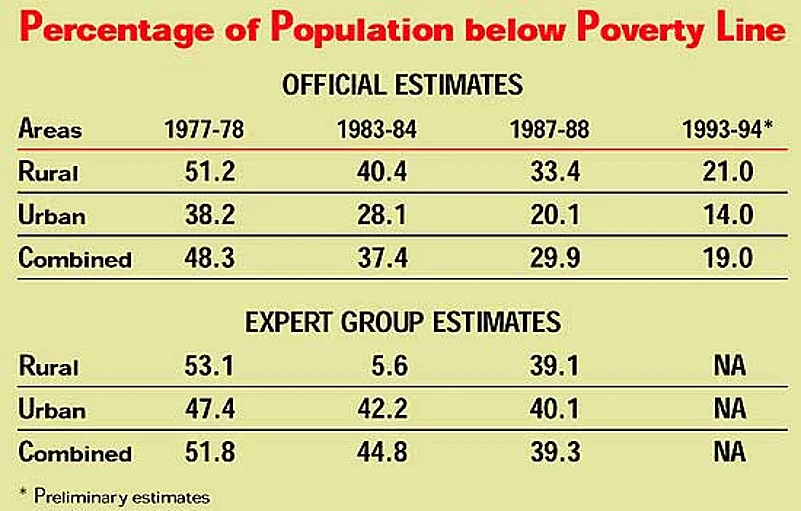
A few months from the elections, the Narasimha Rao Government probably expects to win more than just raves for the poverty estimates released by the Planning Commission in December 1995. The data claims that the lation below the poverty line plummeted to 19 per cent in 94 from 25.2 per cent in 1987-88. While in the urban areas, 14 per cent of the people live below the line, in rural India figure doubles to 21 per cent.
This estimate is based on the incomplete results of a survey ducted by the National Sample Survey Organisation (NSSO), ing consumption patterns of about 500,000 households. more significantly, the methodology used to arrive at poverty mates, and the definition of the poverty line itself, have found takers. Charan D. Wadhva, research professor, Centre for Policy Research, echoes the reaction of most: "Poverty may have come down but the rate of decline cannot be so rapid."
The Planning Commission, which announces these estimates every five years, bases its definition of poverty on the purchasing power needed to meet specific calorie intake (2,100 kilo calories for the urban, and 2,400 kilo calories for the rural areas) per month, with some margin for non-food needs. This consumption basket was translated into Rs 56.64 per person a month for the urban, and Rs 49.09 for the rural population in 1973-74—when the exercise was carried out for the first time. Adjusted for inflation at 1993-94 prices, this increases to consumption worth Rs 264 per person a month in the urban areas, and Rs 229 in the rural.


Says O.P. Mathur, HDFC professor of housing and urban economics, National Institute of Public Finance and Policy: "The non-food items included in the consumption basket are mainly those that assist the food items. For example, kerosene. And these would not account for more than 10-15 per cent of the total items." But is that all there is to the quality of life? Counters Wadhva: "The minimum food intake to keep the body alive is an incomplete measure of poverty. Human dignity requires more than food and a bit of kerosene. What about shelter, access to medicine, primary education, and transport?" Abusaleh Shariff, head, human resource development programme area, National Council of Applied Economic Research, agrees: "It has been established through various surveys that 12-15 per cent of household expenditure per year is on health and education alone."
The debate these figures provoke is not new, but economists are wary of commenting on the latest reckoning because they have access to only what has been made available to the media as press notes. What they do unanimously agree on is that the methodology used to process the data falls short of being convincing. Apart from the NSSO data on consumption, and the rate of inflation as indicated by the consumer price index, the poverty estimates take into account the population projections, and the Central Statistical Organisation (CSO) estimates of total consumption.
The shortcomings may be serious. "A uniform inflation rate is taken for the entire country which has extremely diverse pockets," says Mathur. "Also, the calorie requirement and the composition of the food basket, which is taken as the same for all, differ from region to region." Moreover, the NSSO data, which is collected directly from the people, is not used as it is, the assumption being that people understate consumption. The NSSO figures are thus suitably increased, guided by the consumption figures churned out by the CSO. This method was sought to be corrected by the Lakdawala Committee—an expert group which came up with substantially higher poverty figures for all the years ( see table ) by using the NSSO data as it came in. With the Planning Commission not having adopted this method, the process still awaits a solution.
The current issue boils down to whether the economic reforms have contributed to poverty alleviation at all. "The reduction rate in the fresh data doesn't deflect from the trend seen in the last decade (reforms started in 1991). To that extent, reforms haven't worsened the situation," says Shubhashis Gangopadhyay, head, planning unit, Indian Statistical Institute, New Delhi. "But these figures don't show any structural changes, neither do such averages reflect the depth of poverty, which in India is a clearly regional phenomenon. The relative deprivation among the poor decreased at a faster rate in rural and at a slower rate in urban areas during 1983-87,compared to 1977-83. How these figures behaved in 1993-94 can be assessed only when the data is released."
In the meantime, the United Nations' Human Development Index, based on three indicators—life expectancy, educational attainment, and real GDP in purchasing power parity terms—ranks India 134th among 174 countries. In terms of real GDP per capita, it is ranked 141. Pakistan is 100, China is 123.
For sure, the successive good monsoons must have helped the Government more than the reforms to maintain the poverty reduction rate. "Poverty has reduced both in percentage and in absolute terms," says Wadhva. But in a country where official estimates have seldom been considered sacrosanct, the latest set of figures doesn't even call for one to be an economist to know that it needs to be taken with more than a pinch of salt.


 MP Defections")