Breaking away from the conventional method to measure poverty, the National Institution for Transforming India, better known as Niti Aayog, released its first Multidimensional Poverty Index (MPI) report in the last week of November. Based on the National Health Family Survey for 2015-16, the report disclosed that one in every four persons in India was multidimensionally poor during that time period.
At this point in time, the Narendra Modi government was yet to launch several components of its anti-poverty policy. Anticipating improvement in the national MPI when the next edition of the report is brought out, vice-chairman of Niti Aayog Rajiv Kumar wrote in the MPI report, “India has made remarkable strides through flagship programmatic interventions.”
Economic experts and social scientists, however, think the MPI is just an indicator whereas the economic distress prevailing in the country was much bigger. According to them, the economic crisis triggered by demonetisation was bolstered by the Covid-19 pandemic. Additionally, the social and political climate, they said, was undermining economic and welfare policies.
Although India lifted 271 million people out of poverty between 2006 and 2016, according to the UN’s Global MPI 2019, its Human Development Index 2019 had stated that India still was home to 28 per cent of the world’s poor.
In April this year, Forbes magazine revealed that India has the third-highest number of billionaires in the world, after USA and China. While India does not have inheritance tax, earlier this month the World Inequality Report 2022 revealed “India is among the most unequal countries in the world” and was witnessing “rising poverty and an affluent elite”. It showed that the top 10 per cent and top one per cent of Indians hold 57 per cent and 22 per cent of the national income, respectively.
MPI methodology
The methods employed to measure poverty have always been disputable. The conventional methods adopted by the Planning Commission relied on the Poverty Line. For example, as per the Suresh Tendulkar methodology (2011-12), one who would spend Rs 33 a day in an urban area and Rs 27 in rural areas was not treated as poor. In 2014, the C. Rangarajan committee estimated the Poverty Line as a monthly per capita expenditure of Rs 1,407 in urban areas and Rs 972 in rural areas. The Poverty Line approach was abandoned by the Niti Aayog, which replaced the Planning Commission on January 1, 2015.
It has adopted the MPI approach that seeks to measure poverty across multiple dimensions as per globally accepted methodology developed by the Oxford Poverty and Human Development Initiative and United Nations Development Programme (UNDP). The Indian MPI seeks to understand and record poverty on the basis of daily deprivations in three broader categories—health, education and standard of living. These categories have been further divided into 12 indicators—which include nutrition, child and adolescent mortality, antenatal care, years of schooling, school attendance, cooking fuel, sanitation, drinking water, electricity, housing, assets and bank accounts.
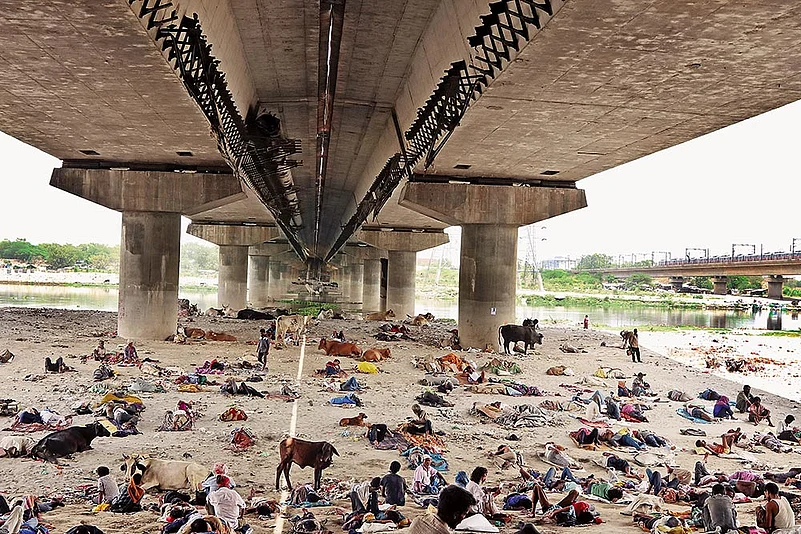
Far from home Homeless migrant labourers sleep under a flyover in Delhi. Photogaph by Suresh K. Pandey
Since MPI’s development in 2010, Pedro Conceição, director of Human Development Report Office, UNDP, stated in the Niti Aayog’s report, “It has served as a valuable analytical tool to identify the most vulnerable people—the poorest among the poor, and revealing poverty patterns within countries over time, thereby enabling policy makers to target resources and design policies more effectively.”
On Niti Aayog’s new methodology, MPI, and its recent report, noted developmental economist Jean Dreze said, “Like all poverty indicators, MPI has its limitations. But it is still quite useful, in so far as it focuses directly on wellbeing indicators instead of resources such as income or expenditure.”
“Interestingly, this way of looking at poverty seems to magnify contrasts, for instance between rural and urban areas, between states, and between social groups. This suggests that the disadvantage of low income or expenditure tends to be compounded by other disadvantages such as low literacy. Standard poverty indicators fail to capture this cumulative impact of multiple disadvantages,” he added.
Arun Kumar, another economist who is also the Malcolm Adiseshiah Chair professor at the Institute of Social Sciences, said, “The report represents only some parts of the reality that the economic situation is really bad in the country. It doesn’t go into a deep understanding of poverty that involves the unorganised sector, black economy, investment patterns and the role of new economic policies. These factors need to be taken into account in any analysis of poverty.”
“Measuring income and consumption remain a challenge, as the sample surveys hardly reach the real poor and the real rich. And that adds to the complications of poverty estimation. Poverty has to be defined in terms of social minimum necessity. If we really want to understand poverty, we must include all social sector expenditures on health, education, food, housing and other items, because one indicator cannot be equated with another,” Kumar said, and continued, “How much weight you give to which indicators becomes a political issue.”
Commenting on India’s vast informal economy, he said, “We have a largely unorganised sector which employs 94 per cent of the workforce. Poverty is entrenched in the unorganised sector especially in agriculture, which has 45 per cent of the workforce. Because over the years, income in this sector hasn’t grown as fast as that in organised sectors, the share of agriculture in national GDP has also dropped to 14 per cent from 55 per cent at the time of Independence.”
Niti Aayog’s MPI report revealed that Bihar, Jharkhand, Uttar Pradesh and Madhya Pradesh were the poorest states in the country. At the other end of the spectrum, Kerala was listed as a state with lowest poverty, followed by Goa, Sikkim, Tamil Nadu and Punjab.
“States where government funds are used in a better way would always show better results. What characterises the poorest states is the black economy, lack of investment and poor governance,” Arun Kumar said. “States that are poor have a larger concentration of unorganised sectors. They have greater domination of agriculture as compared to manufacturing and services sectors.”
With the rise of the private sector since 1991, Kumar said, public intervention has gone down as far as employment generation is concerned. “This has led to a drain of capital from poorer areas to the richer, in spite of efforts of the Finance Commission. The private sector will always invest where the market is bigger. For Uttar Pradesh, the market is Noida and Ghaziabad. So places like Banda and Kanpur are getting deindustrialised. Similarly, Haryana is seeing growth in areas around Delhi. For Maharashtra, it is all about Mumbai and Pune. Sholapur, Kohlapur and Vidarbha—which is struggling with farm suicides—couldn’t develop.”
Poverty and inequality
Poverty estimation is a subject that is always space and time specific, Kumar said. “What indicates poverty and tracks deprivations in one time and space zone can’t be a yardstick to assess the living conditions of people in another. What is poverty in India today is quite different from the poverty in the 1960s, when Planning Commission would assume that the government would give free education and health, and these weren’t included in the Poverty Line estimate,” he added. “But now we take into account education and health as well. Today, a poor person may have a mobile phone, which didn’t exist in the 60s. The social minimum requirements and necessities keep changing. The Poverty Line in the USA is quite different from what it is in India. Similarly, what defines Poverty Line in Ladakh, where, because of extreme cold one can’t survive without proper housing, food and clothing—is quite different from what it is in Tamil Nadu, where one can survive under a thatch wearing a veshti and eating bananas.”
Maintaining that poverty is a political issue as well, Kumar said, “All governments want to show that during their regime, poverty went down. So they would like to calculate it in a way that allows them to do so. Therefore, they play with the concept of what constitutes poverty and data on poverty.”
Deploring new economic policies that have been breeding poverty, Kumar said, “MNREGA is itself a sign of economic distress, because agriculture and non-agriculture sectors in rural areas are not generating enough jobs. World Bank knows that these new economic policies have been generating poverty, which is why we have these social safety nets to prevent people from falling below the Poverty Line. In spite of the government welfare schemes, poverty persists. That is why you have Right to Employment, Right to Food and Right to Education, as people are unable to afford nutrition, healthcare and education.”
“Despite the Right to Food schemes, India had 30-40 per cent women and children who are malnourished, and at least 30 million children engaged in child labour,” he added.
ALSO READ: Harry And The Bihari: Return Of The Native
Referring to last year’s Annual Status of Education Report (ASER), Kumar said, “About 50 per cent of government school students from Class V can’t read a simple text or do the mathematics of Class II level. That means they will never be able to absorb modern technology. Unless we improve our system to ensure quality education to our students, India is assured of having 50 per cent of its population in poverty for the next 50 years. Otherwise, these 50 per cent people will keep doing low scale menial jobs and remain poor.”
On the growing inequality in India, Kumar said, “Even these estimates (World Inequality Report) are based on white economy data. We don’t have a proper income survey in the country—where the unorganised sector is bigger than the organised one. So the wealth disparity will always be bigger than income disparity. Some people save and accumulate wealth. And over a period of time, they invest the wealth and start getting income from that investment. The remaining 50 per cent can hardly save anything. This is the reason that India, being one of the poorest countries in the world, also has the highest number of billionaires.”
Even before the pandemic had hit the economy, said Arun Kumar, 23,000 high net worth entrepreneurs had left India (Morgan Stanley study), and the trend continues. “The social and political environment in the country had not just discouraged investment, but also led to the exodus of those who feel persecuted,” he added.
Who are the poor?
So who are these 25.01 per cent of India’s total population identified as multidimensionally poor by the Niti Aayog? The answer lies in the Global MPI Index 2021, titled “Unmasking disparities by ethnicity, caste and gender”, which was released in October this year. As per this global index report, overall, five out of six multidimensionally poor people in India live in households whose head is from a Scheduled Tribe (ST), Scheduled Caste (SC) or Other Backward Class (OBC) communities.
Asserting that castes and tribes are a more prevalent line of social stratification in India, the report, which was brought out by the Oxford Poverty and Human Development Initiative in association with UNDP, said, “In India, STs account for 9.4 per cent of the population and are the poorest: more than half—65 million of 129 million people—live in multidimensional poverty. They account for about one-sixth of all people living in multidimensional poverty in India.”

Lost childhoods Poor kids at play, in Mumbai. Photograph by Amit Haralkar
The ST group has been followed by the SC group, with 33.3 per cent—94 million of 283 million people—living in multidimensional poverty.
The report added that 27.2 per cent of the OBC group—160 million out of 588 million people—live in multidimensional poverty, showing a lower incidence but a similar intensity compared with the SC group.
Sukhadeo Thorat, Professor Emeritus at Centre for the Study of Regional Development, Jawaharlal Nehru University, said, “Even if you take any other indicator of the poverty such as civic amenities like access to housing, electricity, sanitation, drainage, malnutrition, enrolment or literacy rate, you will find that these communities lag behind the higher castes.”
Thorat, a former UGC chairman, said with a rise in literacy rates and share in the government jobs owing to reservation, there has been some improvement in the economic status of these communities. “But when compared with that of other social groups, the gap and disparity persists because of the slow rate at which their living conditions are improving. The majority of working people from these groups are low paid workers engaged in the informal sector. The reason why they are not on a par with higher caste people is that we haven’t done enough in terms of policy interventions to give them capital assets like agricultural land, entrepreneurship and businesses in the formal sector,” he added.
The most important factor for them lagging behind others, Thorat said, was social and economic discrimination. Stressing on the need for policy interventions for the economic emancipation of these communities, he further said, “The government should acquire and distribute land to them as the majority of people from ST, SC and OBC communities are landless. There is a need for a major programme for their educational development through enhanced scholarships. This will improve their employability in the formal sector.”
Emphasising on the need for providing safeguards against discrimination in the private sector, Thorat further said, “There is a need for policy that ensures them fair representation in the private sector.”
He added that the majority of migrant labourers who lost their livelihoods due to the pandemic belonged to the ST, SC and OBC groups.
Post-pandemic poverty
Arun Kumar, who has authored Indian Economy’s Greatest Crisis: Impact of Coronavirus and the Road Ahead (2020), which details economic collapse in the wake of the pandemic, and subsequent sufferings, said women’s participation in the labour force had particularly decreased in recent years. “The women-headed households have been facing more economic problems than male-headed households,” he said.
He further said that even before the pandemic had hit, our rate of economic growth had declined continuously for eight quarters. “Our economic policies are not being designed to create mass employment. That is why unemployment figures have been rising and even before the pandemic in 2018, joblessness was the highest in the past 45 years,” he said.

Poor kids at play, in Calcutta. Photograph by Sandipan Chatterjee
Calling for major government initiatives to generate “productive employment”, he said, “The organised sector is witnessing jobless growth. In 1990, the private sector had employed 7.5 million people. Now, it has gone up to 13 million. In the mean time, the workforce has grown from 250 to 500 million. So where do these people go? They go into the unorganised sectors that have very low incomes and wages. We need to generate productive employment which is not possible without government initiatives.”
On the severity of the current unemployment crisis, Kumar cited the example of Uttar Pradesh, where over 23 lakh candidates, including 2.22 lakh engineers and 255 PhD holders, had applied for 368 posts of peon in the state secretariat last year.” He asked, “Can you imagine the plight of the uneducated and illiterate people?”
In May this year, a report by Azim Premji University showed that 230 million Indians have been pushed into poverty as the pandemic and lockdowns wreaked havoc on the economy and livelihoods. It noted that the pandemic has taken a far heavier toll on poorer households, maintaining that 47 per cent of women suffered a permanent job loss during the lockdown.
Surajit Das, a professor at Centre for Economic Studies and Planning, Jawaharlal Nehru University, shared the findings of a survey that was spread across Bihar, Odisha (Cuttack city), Delhi, Gujarat, Haryana, Kerala, union territory of Ladakh, West Bengal, Sikkim, Telangana, Tripura, Uttarakhand, Uttar Pradesh, Goa and Assam. “Without any doubt, economic distress has grown in India after the lockdown, adversely affecting social mobility. During our study, almost 50 per cent of respondents reported absolutely zero income during the lockdown. The same number of them reported an increase in their indebtedness. Although the promise of free ration, cash transfer in Jan Dhan accounts, and free LPG cylinders was initially made under the Garib Kalyan Yojana and later Atmanirbhar Bharat Abhiyan packages, implementation of these schemes varied widely from state to state,” he said, adding, “At least 74 per cent of the sample families either did not have Jan Dhan accounts, or have not received any money in that account.”
Road to remedy
Both Arun Kumar and Surajit Das stressed that the government needed to invest more in health, education and rural as well as urban employment guarantee schemes.
“If you look at South-East Asia, China and India, we were at the same level of poverty, illiteracy and ill-health in 1947. They pulled ahead because they invested massively in education and health,” Kumar said, adding “In spite of government interventions—whether it is in the form of housing, food or supply of cooking fuel—poverty persists. The problems will be solved only when we give productive employment to the people. If people don’t have an education, you can’t skill them. Therefore, education and nutrition are both very critical.”
Explaining how schemes like MNREGA have prevented the economy from collapsing further, Kumar said, “While the government allocated Rs 1 lakh crore to MNREGA to boost employment opportunities in villages and bring relief to migrant labourers, the amount should have been Rs 3 lakh crore, in view of the crisis. The number of workdays should also be raised to 200.”
Das said state governments were not following the orders that were issued on September 23, 2019 by the Chief Labour Commissioner at the Ministry of Labour and Employment, which revised the minimum daily wage for unskilled agricultural labourers to Rs 347.
The growing economic distress and uncertainty could have an adverse impact on mental health of the poor, if remedial measures were not taken in time, Das said, adding, “Besides starvation deaths, this will lead to law and order problems due to an increase in anti-social activities.”
(This appeared in the print edition as "The Elephant in the Room")