It is a mysterious, but happy and comforting, truth about math. The worth of a thing, either real or perceived, can whistle through the air, and go up a million times. At the same time, value obliteration is constrained and conservative. The price of a product or a stock can whittle down to zero, or lead to a maximum 100 per cent fall. So, while the gains can be infinite, losses are limited. This is possibly the most crucial lesson in wealth creation, and the one that’s never taught.
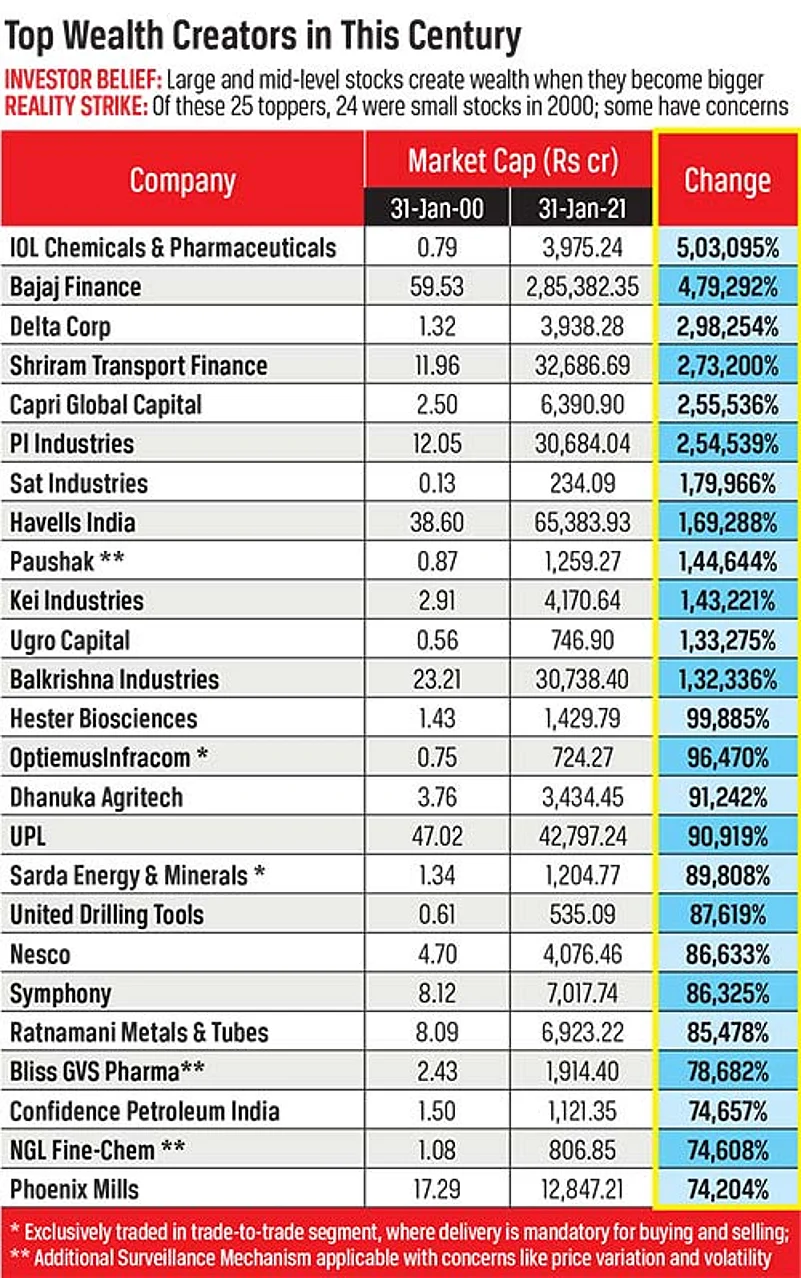
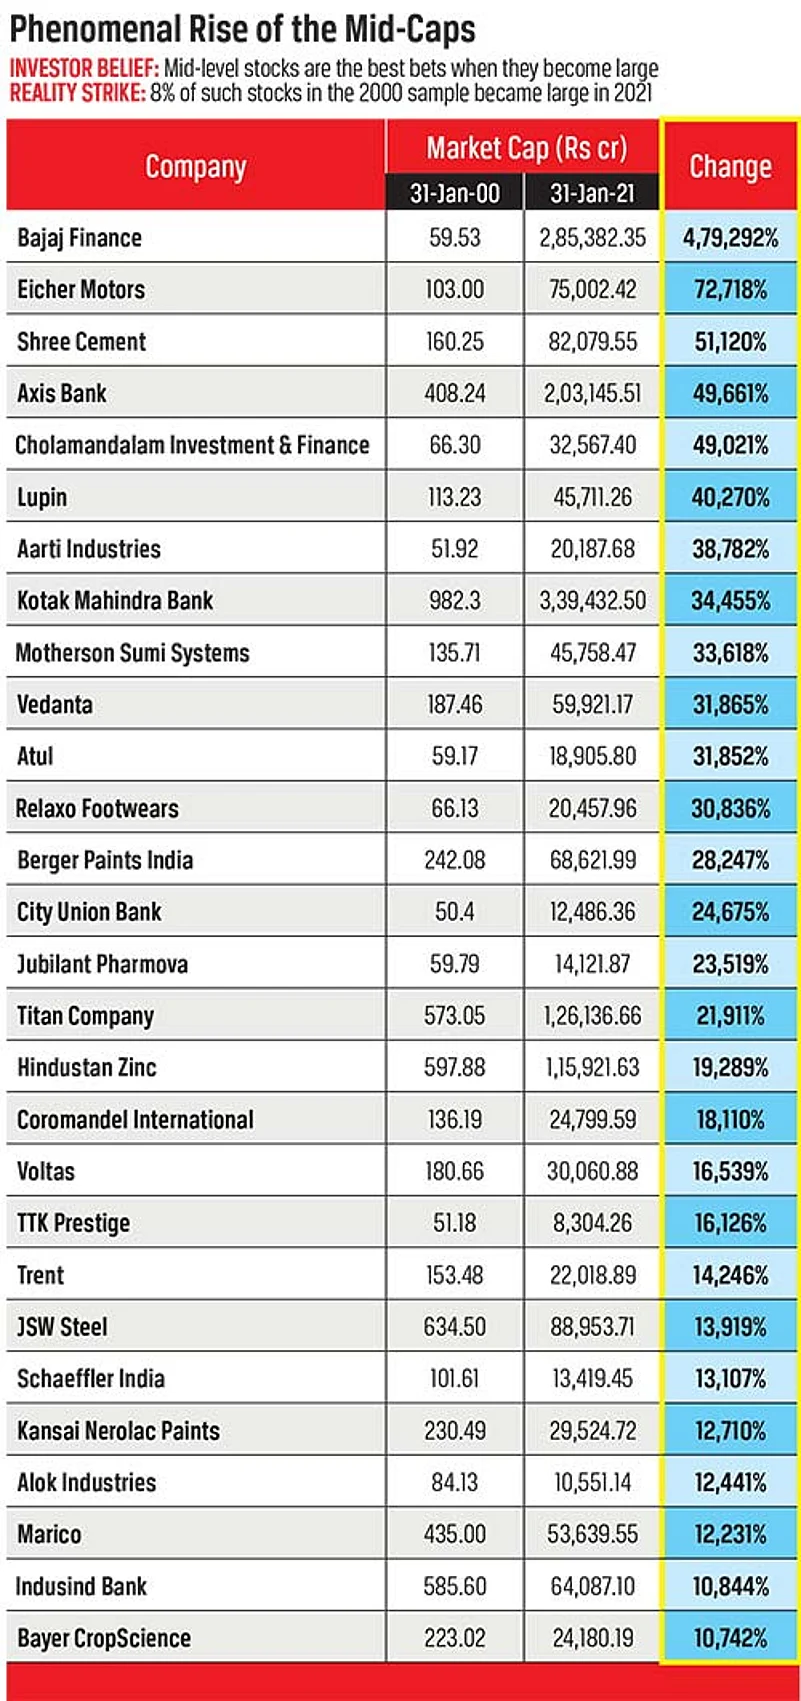
This curious character about calculations is a huge boon. It is a facet that possibly helped the human race to achieve control over the planet, and reach the heights (or depths) of culture and civilisation. The reason: our brains are wired so that they exaggerate negative emotions, and play down the positive ones. While you are thrilled with positive returns, you feel worse about similar losses. In essence, a Rs 100 decline in what we own affects us more than a Rs 100 hike. Hence, attending to percentage arithmetic enables us to feel more pleasure due to unrestrained highs, and dents our sorrows due to the limits on lows. So, let your joys be unbounded when we tell you about stocks, whose market capitalisation—combined value of the shares—went through the sky between January 2000 and January 2021. The hike in the case of IOL Chemicals & Pharmaceuticals was a stupendous 503,000 per cent. You read it right, though it seems out of Ripley’s Believe It or Not.
If you think of this as a one-off ‘Act of God’, consider other stocks such as Bajaj Finance (a rise of 479,000 per cent during the 21-year period), PI Industries (254,500 per cent), and Balkrishna Industries (132,000 per cent). Welcome to the magical land of Indian equities, where stocks perform unimaginable tricks. Like the combined characters of Harry Potter, Peter Pan and Frodo, they wave their wands, build never-seen neverlands, and possess rings with terrible temptations.
Only a few fortunate investors are caught in these wealth-creating whirlpools, and the unexpected destinies that sink them initially. Only later do the fearsome forces generated by the irrational exuberances propel them on to the peaks of Himalayan treasures. The investors find themselves in a wondrous world only because it is there.


No one, neither the incredulous winners, nor the majority that stares in a stupefied manner at these miracles, can imagine such returns. No one ever will.
When we dug for the gems among the 1,800-plus stocks that were traded on the Bombay Stock Exchange in January 2000 (see Methodology), we were sure that we would find the obvious names—Reliance Industries, ICICI Bank, Infosys and Bharti Airtel. It was with awe and disbelief that we looked at the top 25 stocks, whose market caps registered shocking and eye-socking growths in this century. They stumped and pumped us. These jewels revealed that a successful stock-picking strategy is like a random and drunken walk in the investment wilderness.
Whatever one may say in retrospect, whichever story one may spin to justify, wealth creation is partly, sometimes largely, a matter of luck. Dame Fortune favours the brave; of course, it also helps fools, who rush in where angels fear to tread. In fact, in 2000, no one could have guessed that any of these 25 bright specks would outshine the stars, quasars and supernovas in the universe of stocks. Even today, every expert worth her salt will urge you to treat some of them as untouchables.
Is it worthwhile to push your luck with penny stocks?
At the turn of this century, some of these companies were puny, and their shares worthless. As on January 31, 2000, six of the 25 stocks had a market cap of less than Rs 10 million each. The respective figure for another five was between Rs 10 million and Rs 20 million. Five more had a market cap of less than Rs 50 million each. Hence, two-thirds could be dubbed as penny stocks, or those which are highly risky, volatile and capable of causing massive cardiac arrests among investors.
People like you and I are advised to avoid them like the plague. IOL Chemicals, for example, was available at 33 paise. Volumes were minuscule. On October 8, 2002, 100 shares of Dhanuka Agritech (market cap change in 2000-21: 91,000 per cent) changed hands in a single deal valued at Rs 690. Even on January 29, 2021, less than a 1,000 shares were sold in just over 100 deals. In such cases, there is invariably a fear that interested parties may be at work.
Still, there were lucrative choices among the smaller firms. Take the case of Phoenix Mills (market cap rise in 2000-21: 74,000 per cent). Like many textile mills in Mumbai, it was on the financial hospital’s sickbed by the late 1980s. It entered the real estate sector, and its first mall, High Street Phoenix (HSP), “emerged as the most frequented destination in Mumbai”. By 2001, with the launch of Big Bazaar’s first store, and Food Bazaar, HSP was a model of “retail-led (realty) development”.
“It is true that if you can pinpoint an attractive small stock, backed by homework, the future returns can be way higher than its larger counterparts. At the same time, if you compare the number of small- and mid-size companies that gave super-normal profits with those that became or remained penny stocks, the ratio is likely to be 1:5. There are more chances that such investments will erode an investor’s capital,” explains Pranav Haldea, MD, Prime Database Group.
This is why Shankar Sharma, vice chairman and joint MD, First Global, advocates a two-pronged strategy. The first is never to bet more than 20-30 per cent of your money on small stocks. The second is to choose half-a-dozen or more such shares that exhibit strong fundamentals and potential, and pray that at least 1-2 grow into larger companies in five years. This is akin to the approach of venture capitalists, who invest in unknown start-ups, and hope for a 1:10 success ratio.
Are large stocks really safe and sound?
Obviously, the flip side of the penny coin is to be risk-averse, and buy shares of companies with proven records. This essentially implies the inclusion of larger companies in your portfolio. This makes sense. Almost half of the 87 large stocks, which had a market cap of over Rs 10 billion each in January 2000, grew by more than 10 times in this century. A few of them grew by more than 100 times. (The 10-times cut-off is important as your money vaults by eight times at 8 per cent interest in 21 years.)
Let’s look at these stocks from the current perspective. Today, the market is fanatical about the ‘HRITHIK’ stocks, named after Bollywood actor Hrithik Roshan (of Dhoom 2 and Krrish fame). These include HDFC Bank, Reliance Industries, Infosys, TCS, HDFC, ICICI Bank and Kotak Mahindra Bank. Of these, the three banks grew by more than 150 times in the past 21 years. The superstar among them was Kotak Mahindra Bank, whose market cap catapulted by almost 350 times.
“The larger stocks are considered safe and risk-free because they have strong balance sheets, decent cash flows and long-term growth plans. During the tough times, they perform better, and witness comparatively lower volatility (free falls) than the smaller ones,” feels Ajit Mishra, vice-president (research), Religare Broking. “As the economy grows, the larger the size of a company, the higher is its ability to expand,” says Deven Choksey, MD, KR Choksey Shares & Securities.
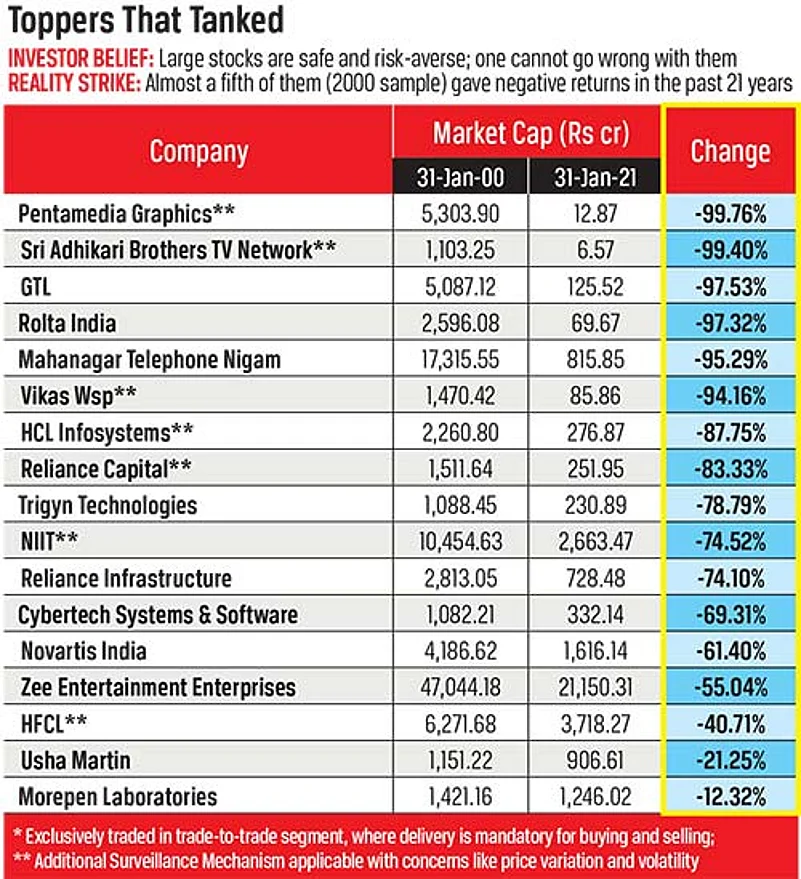
But these are not absolute truths. In the stock market, uncertainties rule and black swan events, or the most incredible ones, dominate. Thus, don’t be dazed and crazed if we tell you that almost a fifth of the 87 large stocks in January 2000 showed negative returns by 2021. A few of them wiped out the investors’ money, as they collapsed by over 90 per cent. Even those where the sheer drop was 20 per cent or less rendered the initial investments near-zero if one accounts for inflation.
In some cases, the losses to the investors were higher than what’s visible from a date-to-date (January 31, 2000 to January 31, 2021) comparison. The two Reliance Group companies, Reliance Capital and Reliance Infrastructure, became a part of Anil Ambani’s empire after the 2005 split between the two brothers. Their market caps went up by 1,200 per cent and over 700 per cent, respectively, between 2000 and 2010. They plummeted by 99 per cent and 97 per cent, respectively, over the next 11 years. Together, they decimated Rs 420 billion.
“Bets on large stocks are not always foolproof. These firms can suffer from disruptions in business models, resistance to change, over-leverage, faulty capital allocation policies, and corporate governance issues. A review of the portfolio at regular intervals is necessary,” explains Deepak Jasani, head (retail research), HDFC Securities. “In strong bull markets, the large stocks do not necessarily offer the same potential for higher returns as the smaller ones,” adds Hemang Jani, head (equity strategy, broking & distribution), Motilal Oswal Financial Services.

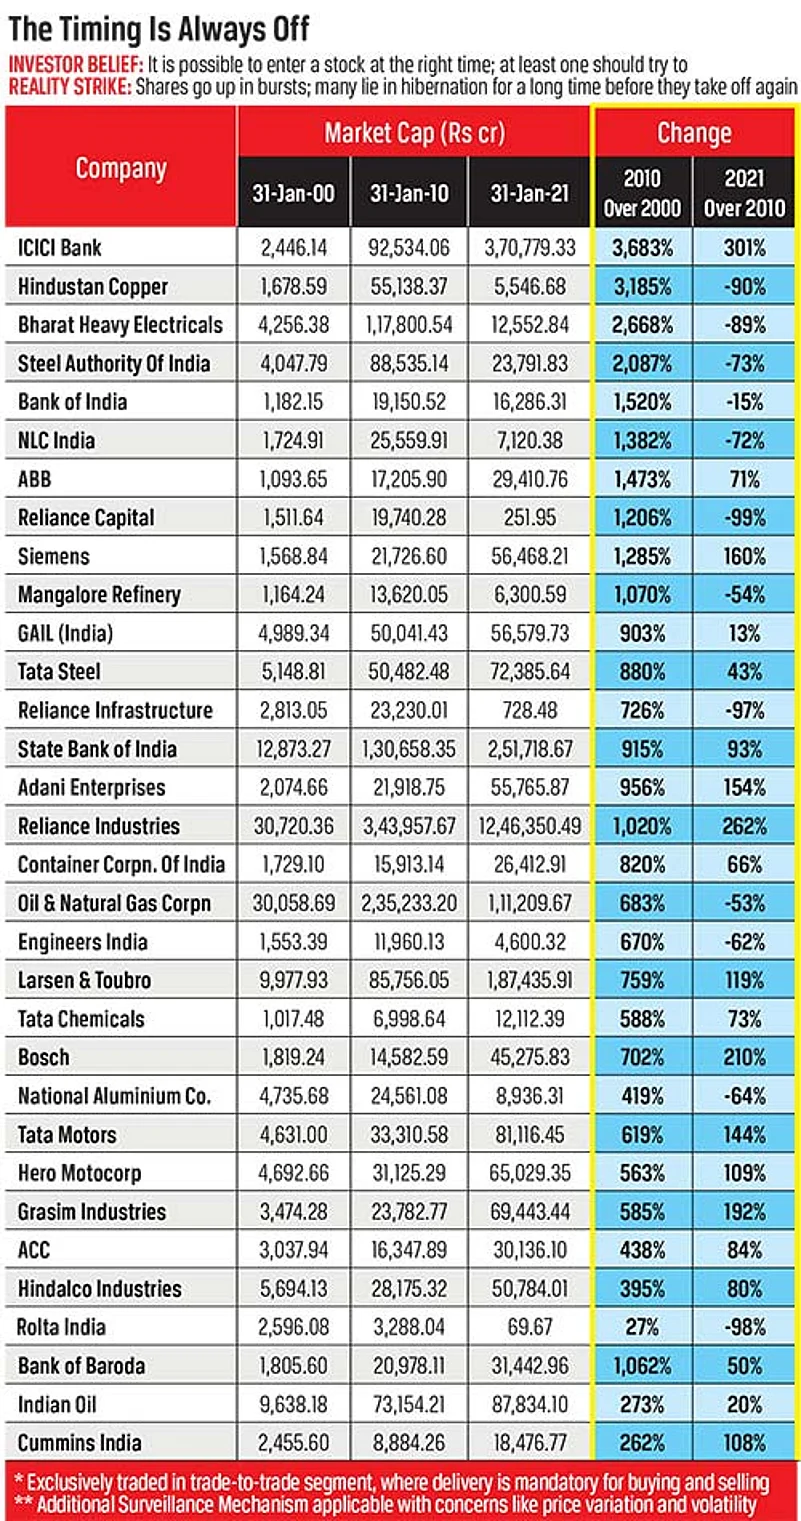
Don’t try to time the markets. You will fail miserably.
Every investor wishes to enter the market at the right time. She hopes to buy the right stock at the right time to ride the complete upward wave like a surfer on the sea. However, given the arbitrary and absurd nature of stock movements, this never happens. “Most stocks, 90-95 per cent of them, give returns in spurts, like a runner who sprints, pauses for breath, and takes off again. Equities don’t fetch fixed annual returns like fixed deposits,” says a categorical Shankar Sharma.
Data proves this dictum. If we compare market cap changes in the 2000-10 and 2010-21 periods, there are huge differences in the case of several stocks. ABB grew by nearly 1,500 per cent in the first phase, and by 70 per cent in the second. The respective figures for Siemens were 1,300 per cent and 160 per cent. Tata Steel jumped by almost 10 times in the first 10 years, and then sluggishly added Rs 220 billion in market cap in the next 11 years, which was half of what it did in the former period.
Almost half of the 87 large stocks in 2000 showed the above trend. They took off in the first decade of this century, and then slowed down considerably in the next 11 years. Of course, the other half of the stocks showed an opposite tendency. In many cases, there were long periods when the stock prices moved in a band, as if they were chained and jailed. Stocks behave like your pet Greyhounds. They are on a leash most times. But when free, they run at 45 miles an hour.
Consider the gyrations in Reliance Industries’ stock. In January 2008, it was at Rs 3,000. Thanks to the global crisis, it floundered and slipped to Rs 1,000 by the end of the year. In 2009, it doubled its price before the bonus issue (free shares given to existing shareholders as a reward) in November, after which the price was mandatorily back at Rs 1,000.
For the next seven years, it remained below this level, and went up to Rs 1,600 prior to its second bonus in September 2017.
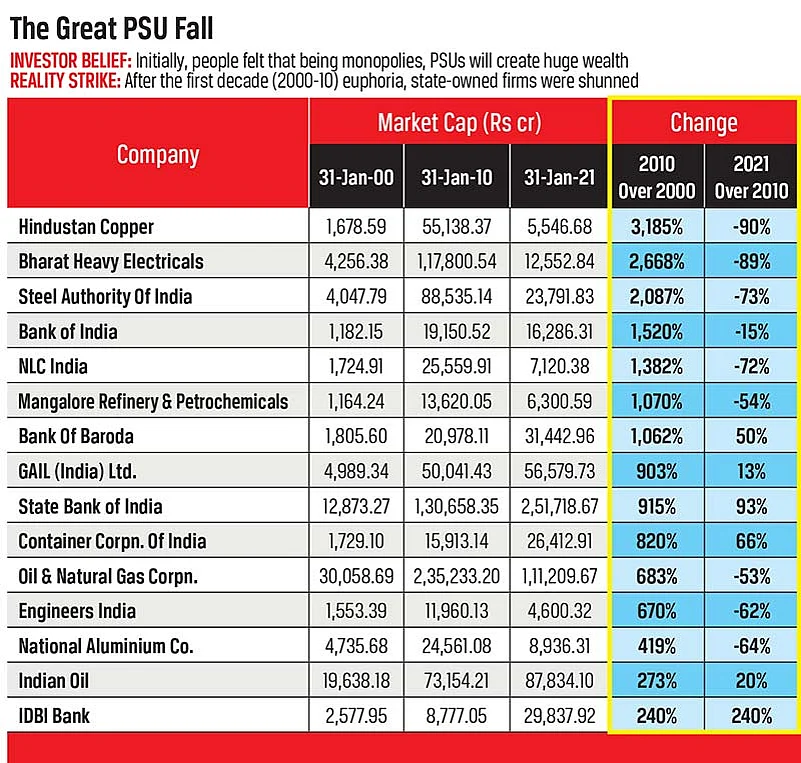
Why did almost everyone lose their shirts in PSU shares?
It was a wild party for the PSUs between 2000 and 2010. Investors obsessed with their shares, whose prices constantly accelerated without any brakes. The market cap of Hindustan Copper was up more than 30 times during the decade. The respective figures for Bharat Heavy Electricals and Steel Authority of India were 28 times and 22 times. In fact, ONGC with a market cap of more than Rs 2 trillion was the second largest stock behind Reliance Industries.
Everything went haywire between 2010 and 2021. Nine out of the 16 PSUs showed a steep decline in market caps. ONGC and Bharat Heavy Electricals lost more than Rs 1 trillion each, and Steel Authority shed Rs 650 billion. It was wealth devastation of the worst kind. Imagine a loss of almost Rs 3 trillion in 11 years and that too in three companies. ONGC hit a 16-year low, the price of Bharat Heavy Electricals’ share was at its lowest since September 2003, and NTPC traded at its 2005 levels.
“PSUs are orphans because both their owners (government) and top managers change regularly, the former after five years and the latter generally in three years. Investors tend to victimise them for these reasons,” explains Deven Choksey. “Private promoters interact more frequently with investors, especially institutions, through analysts’ calls and conferences. This engagement is still lacking in PSUs, and somehow subdues investors’ perceptions,” feels Pranav Haldea.
However, such arguments seem facile. Ever since the PSU stocks were initially listed on the exchanges in the 1990s, these factors were at work. Governments changed; in fact, most of them in the 1990s were coalitions unlike the past two terms. And state-owned firms continued to be oblivious of the investors’ concerns. Thus, there were no reasons for the boom in their market caps during the first decade of this century. The owners of these shares should have discarded them.
What made the PSUs ugly and distasteful was the manner in which the governments treated them as cash cows to finance their fiscal deficits and wasteful expenditures. Profitable firms were asked to pay higher annual dividends, most of which went into the official coffers; they were forced to buy shares in other PSUs to meet the yearly disinvestment targets, and they became the political fall guys in times of crises. In effect, the companies did everything that investors abhor.
One of the finance ministers had the grandiose idea to create an Indian-global major like ExxonMobil through mega-mergers of state-owned units. So, ONGC was urged to use its mountain of cash to buy an oil marketing firm. Thanks to the pressures of oil diplomacy, it was forced to pay a higher-than-market price for assets in Russia. In addition, political expediency demanded it to buy an ailing company in Gujarat that was saddled with huge debt, and had nil oil or gas reserves.
How do bonus issues invariably push up market caps?
When firms spew out too much cash and accumulate it in reserves, there comes a time when there is considerable pressure from the shareholders to share this huge amount with them. Normally, managements prefer to issue bonus shares, which are given free to existing shareholders, to distribute cash reserves and higher dividends to allocate extra profits from annual operations. Bonuses in this case are not annual affairs, but one-off events that are repeated after several years.
In theory, there are no immediate gains to the investors—if the bonus is given in 1:1 ratio, they get a share for every share they own, but the stock price is halved, or reduced in the same proportion. The companies don’t lose much as the cash is lying free and unused as reserves. Its share capital doubles, if it is a 1:1 bonus, but the market cap remains the same because of a proportional decline in the stock price. In effect, it is almost a zero-sum game—or this is what we believe.
But theory doesn’t account for human feelings, especially the negative ones like greed. In practice, investors wish to have their cake and eat it too. In this case, it implies that they want the free bonus shares, and also that the share price doesn’t tumble and remains at the same pre-bonus level. In essence, the shareholders want to double their investments in case of a 1:1 bonus—double the number of shares they own, even as the stock price remains the same.
This innate selfishness plays out in different ways in the stock market. A whiff of a bonus issue is enough to trigger a buying frenzy in a specific stock. Theoretically, this makes sense for an existing shareholder who can get twice the number of shares in 1:1 bonus. But what this buying achieves is almost insidious. It pushes up the price, sometimes, to an extent where the post-bonus stock price is almost the same or even higher than its level before the mini-rally began due to fresh buying.
Sun Pharmaceuticals’ bonuses in 2004 and 2013 prove this. In January 2003, the stock price was Rs 300, and shot up to Rs 600 by December the same year. In May 2004, it reached Rs 750. The post-bonus price of Rs 400 was higher than the Rs 300 level of 16 months ago. In a similar vein, the stock ruled at Rs 500 in January 2012. By March 2013, it was Rs 800, and crossed Rs 1,000 in another two months. The post-bonus price in July 2013 was Rs 569 or higher than Rs 500 about 18 months ago.
Greed, in fact, ensures that investors are not satisfied with the above gains. They further push up stock prices after the bonus issue. In the case of Sun Pharmaceuticals, the price was back at Rs 750 by February 2006 or within 20 months of the first bonus issue in 2004. Similarly, the price was back at Rs 1,000 by March 2015 or within 20 months after the second bonus issue in 2013. Thus, the investors’ profits as well as the company’s market cap got a double boost.
Is long-term the only lens to look at the stock market?
Every expert advises us to remain in the market for the long term, even though we may be dead at the end of this period. They dissuade, rather prevent, you from dabbling in short-term trades or seeking easy pickings. But, as any experienced investor will admit, the real money lies in being able to catch the periodic rides that a stock takes. Not ride with the waves, for that is akin to timing the market, but catch them somewhere in the middle and exit before or after their peaks.
Such truths, although risky, stare at you regularly. There are whopping listing gains to be made during an IPO (initial public offering), when a stock lists at a price that may be 100 per cent higher than its offer one. In cases of mergers or acquisitions, especially the hostile ones, the likelihood that the stock price of the target company may go up are unusually high. We have already seen the so-called bonus effect, which also plays out during rights issues and stock splits.
Hence, apart from the 21-year date-to-date comparison in market caps, we looked at stocks that were listed fairly recently, but gave fantastic returns within a few years. Obviously, we felt that this too is a part of the bizarre stock market narrative. Consider TCS, which was listed post-2000, but now tussles with Reliance Industries as the stock with the largest market cap on the Indian equity market. As on January 31, 2021, the difference between the two was Rs 780 billion.
Between January 31, 2010, and January 31, 2021, i.e. a 11-year period, TCS’s market cap zoomed by more than eight times. In the past three years, since 2018, it has almost doubled. This is a remarkable achievement because such growths were achieved over huge bases—on January 31, 2010, TCS’s market cap was almost Rs 1.5 trillion. Only a few large stocks like Bajaj Finance and Asian Paints, and none of the six other ‘HRITHIK’ stocks, could better this consistency.
Avenue Supermarts is another example of a stock that sizzled within a few years, and made its promoter, Radhakishan Damani, the fourth richest Indian (Forbes list, February 2021). Between January 2018 and January 2021, its market cap was up by almost 2.5 times. From Rs 640 on the BSE in March 2017, the price almost doubled by the end of the year. By end-2018, it was Rs 1,600. Before the Covid crisis, it almost touched Rs 2,500. After a brief stutter, it crossed Rs 3,000 in March 2021.
Clearly, the dramatics in the stock market arena are eye-popping, and defy most of the ardent beliefs that investors have. It is a theatre where characters (stocks) come and go, blaze and become black holes (from which no light escapes), and amaze and dishearten the viewers. Some shares linger on for a long time, but the long-term in each case is different and constantly changing. If there is one lesson to learn, it is that there is no lesson to be imbibed and digested.
***
Gem of Gems
IOL Chemicals & Pharmaceuticals
Market Cap Soar – Change (2000-21): 5,03,095%
This is the kind of precious stone we covet. But this is a jewel that eludes us. Not even the most brilliant expert could have predicted its worth. Moreover, such stones are generally hawked by fakers and swindlers. This stock is a creation of the COVID crisis. In 2003, it was worthless at 33 paise a share, but reached Rs 50 in 2005, Rs 100 in 2007, and Rs 200 the next year. By 2013, it skidded to Rs 15. It went up to Rs 150 in 2016, back to Rs 50 the next year, rose again to Rs 100 in 2018, and reached Rs 200 by February 2020. By March, when the world understood the decimating potential of the COVID virus, IOL Chemicals was back to Rs 150. From thereon, like the Ruppell’s Vulture, which can fly up to 11,300 metres in the sky, the stock soared—to Rs 800 within a few months, before it settled down below Rs 600.
Bajaj Finance
Market Cap Rumble – Change (2000-21): 4,79,292%
At the beginning of the century, the stock largely languished below Rs 50. The take-off happened in 2003-04, and the price crossed Rs 200 in 2005. By end-2007, it crossed Rs 400. By early 2009, thanks to the Global Financial Crisis (2008), it was back to Rs 50. Within months, it zoomed to Rs 300, and crossed Rs 800 in 2010. There was no stopping thereafter. In January 2015, the stock crossed Rs 4,000, and it sprinted past Rs 10,000 in 2016. A mandatory change in the share’s value in the same year ensured that Bajaj Finance began a new journey from Rs 1,100 onwards. By 2018, it crossed Rs 2,000 again, in February 2020, before the COVID crash, it was about to touch Rs 5,000. But the price slumped to below Rs 2,000 within weeks. Before the end of the year, it crossed Rs 5,000. As an analyst report stated, “Bajaj Finance has sailed through the headwinds and emerged stronger with a leaner operating model and robust growth guidance.” In May 2020, Bajaj Group’s patriarch, Rahul Bajaj, gave up the company’s chairmanship in favour of his son, Sanjiv. The country’s largest NBFC may soon get a banking licence.
ICICI Bank
Market Cap Trumpet – Change (2000-21): 15,058%
For most of this century, and even during the 1990s, it was considered one of the most aggressive banks in India. It was also embroiled in unsavoury controversies. Despite this Janus-like image, the stock was adored by individual and institutional investors, and witnessed a steady, and rapid, climb. Before the 2008 global crisis, the stock price was over Rs 1,000, which slumped to almost Rs 300, and recovered back to Rs 1,000 in 2010. A new journey, thanks to mandatory exchange-related changes, began in end-2014, and the price journey commenced from Rs 350. The price remained depressed as the bank grappled with the ‘Great Nepotism Scandal’, when Chanda Kochhar, the live-wire CEO, was accused of doling out loan favours to the Videocon Group, which gave financial help to Chanda’s husband, Deepak. Fortunes changed in 2019, and the price almost reached Rs 550. Between February and April 2020, the price dropped to below Rs 300, but regained lost ground, and reached new heights of Rs 600 by February 2021.
Reliance Industries
Market Cap Roar – Change (2000-2021): 3,957%
For a stock whose market cap was high—approximately Rs 310 billion—in January 2000, to have catapulted more than 40 times in 21 years is fantastical. Among the large-cap shares in 2000, a handful showed such jaw-dropping returns. These included ICICI Bank (152 times), Asian Paints (125 times), and Aurobindo Pharma (45 times). But they had lower bases as their market caps were less than Rs 25 billion each, or less than a tenth of Reliance Industries. Despite such a glorious past, there is a saying about Reliance—you can rely on it, but it requires nerves of steel to stick with it. For example, the share went into a deep hibernation between 2009 and 2017. Its price, especially after a bonus issue in 2009, seemed stuck. Later, after another bonus in 2017, the price skyrocketed in 2019. After a brief, transitory halt—actually a one-third hit—due to COVID in early 2020, its stratospheric rise continued.
Gem of Glass
Hindustan Copper
Market Cap Whimper – Change (2010-21): Negative 90%
Can you imagine a money-maker that turns into a dud within a decade? This is the sad and dismal story of the state-owned copper-maker, whose market cap galloped by almost Rs 3,200 per cent between 2000 and 2010, and then went into a free fall over the next 11 years. From a stock price of nearly Rs 600 in 2010, it thudded down to below Rs 20 in March 2020. In the process, the entire market cap was almost wiped out. In fact, the COVID crisis helped as global copper prices went through the roof, and the metal was dubbed as the ‘New Gold’. The share price rose by more than five times. Despite outstanding financial results in the recent past – highest sales and net profits in the Oct-Dec 2020 quarter – www.marketsmojo.com rates the stock’s quality as “below average”.
Zee Entertainment
Market Cap Meow – Change (2000-21): Negative 55%
In January 2000, there were three stocks whose market caps were higher than that of this media giant, a pioneer in broadcasting and cable distribution. At over Rs 470 billion, Zee’s valuation then was higher than that of the current darlings such as Reliance Industries, TCS, Hindustan Unilever, HDFC Bank, Bharti Airtel, and ITC. In January 2021, there were 158 stocks with higher market caps. Over the past few years, the Zee Group was burdened with burgeoning debt, which led to multiple crises. Subhash Chandra, the patriarch, sold promoters’ holdings to raise cash. Worse, since a part of the promoters’ stake was kept as collateral with the lenders, they sold the shares to recover their dues. Investors lost interest. Thus, there were multiple selling pressures, and the stock plummeted from its dizzying heights between January 2018 and March 2020, before it recovered a bit in the recent past.
***
Methodology
We considered the long term, a period of 21 years, instead of a focus on short-term gyrations. We looked at the 1,800-odd stocks that were traded only on the Bombay Stock Exchange in January 2000. These included the large companies, whose market capitalisation, as on January 31, 2000, was Rs 10 billion and more, mid-size firms (market cap: between Rs 500 million and less than Rs 10 billion), and the small ones (below Rs 500 million).
Although we tracked their topsy-turvy, rational and irrational, and exuberant and exalted movements over the next 21 years, we froze on two dates of comparison—January 31, 2010, and January 31, 2021. The rise or fall in the market caps of these shares was translated in percentage terms. And voila! Right in front of our eyes danced several tantalising and unbelievable trends. We rubbed our eyes in disbelief, and our hands in pleasure.
The data is from Value Research, but there may be discrepancies in the information. This is not a ranking, but a listing to show the way prices and market caps move in weird and wacky ways. The companies listed on the BSE after January 2000 are not reflected. But some of them, like TCS and Avenue Supermarts, are mentioned in the main text. The increase in market caps of such shares occurred in a few years.
Disclaimer:
- This is an arithmetic and statistical exercise, and should not be construed as an investment guide.
- We have attempted to pinpoint shares that have negative tinges in the various tables. But this may not be comprehensive.
- Investors have different risk appetites; hence, each needs to consult an expert.
- The raw metadata to study market caps may have inherent gaps, which were missed by our internal research team.