Despite farm fires dropping to their lowest levels in several years, Delhi-NCR has endured another suffocating winter.
A new analysis by the Centre for Science and Environment (CSE), based on CPCB data, shows that carbon monoxide levels exceeded permissible limits on more than 30 out of the 59 days assessed at at least 22 monitoring stations.
CSE’s assessment notes that early winter pollution has stabilised at unhealthy levels driven largely by local emissions, even though stubble burning declined sharply this year.
Delhi’s Daily Pollution Spikes Driven Mainly By Traffic, Not Stubble: Study
Centre for Science and Environment’s assessment notes that early winter pollution has stabilised at unhealthy levels driven largely by local emissions, even though stubble burning declined sharply this year.

Summary
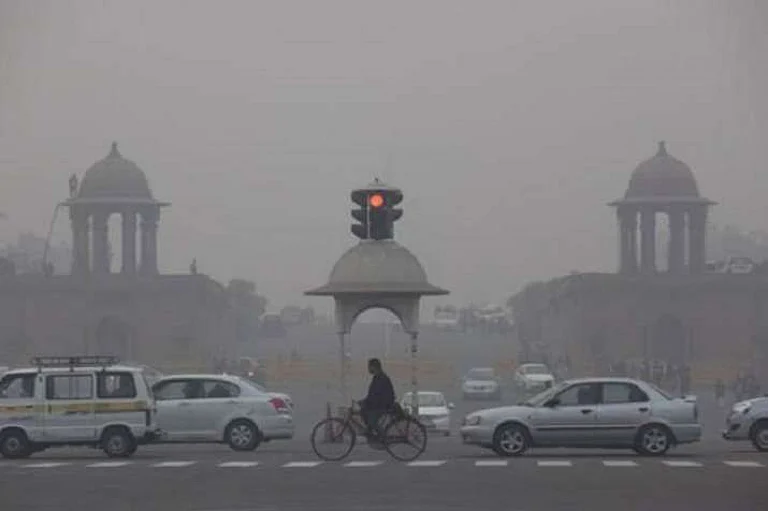
Despite farm fires dropping to their lowest levels in several years, Delhi-NCR has endured another suffocating winter. For most of October and November, air quality remained stuck between the ‘very poor’ and ‘severe’ categories as a growing “toxic cocktail” of PM2.5, nitrogen dioxide (NO₂) and carbon monoxide (CO) from vehicles and other local combustion sources dominated the season.
A new analysis by the Centre for Science and Environment (CSE), based on CPCB data, shows that carbon monoxide levels exceeded permissible limits on more than 30 out of the 59 days assessed at at least 22 monitoring stations. Dwarka Sector 8 reported the highest number of breaches at 55 days, followed closely by Jahangirpuri and Delhi University’s North Campus, both registering 50 days above the limit. The same study points to a steep rise in pollution hotspots across the capital. While only 13 locations were officially flagged in 2018, many more neighbourhoods now routinely report pollution levels significantly higher than the city average.
According to the findings, Jahangirpuri registered the highest annual PM2.5 average at 119 µg/m³. It was followed by Bawana and Wazirpur at 113 µg/m³, Anand Vihar at 111 µg/m³, and Mundka, Rohini and Ashok Vihar, which all recorded annual averages between 101–103 µg/m³. New additions to the list of hotspots include Vivek Vihar, Alipur, Nehru Nagar, Siri Fort, Dwarka Sector 8 and Patparganj. Smaller towns beyond Delhi also suffered longer and more intense smog episodes this year. Bahadurgarh faced the season’s longest uninterrupted smog spell, a ten-day stretch from November 9 to 18, reinforcing the view that the wider region increasingly behaves as a single, heavily polluted airshed.
CSE’s assessment notes that early winter pollution has stabilised at unhealthy levels driven largely by local emissions, even though stubble burning declined sharply this year. The study links much of the seasonal pollution to the interaction of PM2.5 with traffic-related gases. PM2.5 rose and fell almost in sync with NO₂ during peak traffic hours, with sharp increases observed between 7–10 am and 6–9 pm as emissions accumulated under shallow winter boundary layers. While NO₂ displayed swift, traffic-linked spikes, PM2.5 showed slower, broader surges. CO concentrations also exceeded the eight-hour standard at several monitoring stations.
Advertisement
“This synchronised pattern reinforces that particulate pollution spikes are being fuelled daily by traffic-related emissions of NO₂ and CO, especially under low-dispersion conditions,” said Anumita Roychowdhury, executive director (research and advocacy), CSE. She added, “Yet, winter control efforts remain dominated by dust measures, with weak action on vehicles, industry, waste burning and solid fuels.”
The subdued stubble burning in Punjab and Haryana this year, partly the result of floods disrupting the crop cycle, meant its contribution to Delhi’s pollution stayed below 5 per cent through most of the early winter. On a few days it increased to 5–15 per cent and reached a peak of 22 per cent on November 12–13. Although this prevented episodes of extreme spikes, it did little to improve day-to-day air quality. PM2.5 remained the prevailing pollutant on 34 days, followed by PM10 on 25 days, ozone on 13 days and CO on two days. Throughout November, the AQI stayed lodged between the ‘very poor’ and ‘severe’ categories, illustrating the dominant influence of Delhi’s local sources comprising transport, industry, waste burning and domestic fuel use.
Advertisement
While peak pollution levels were lower than in the past three winters due to fewer firecrackers and reduced farm-fire impact, average pollution levels showed almost no meaningful improvement. PM2.5 concentrations during October–November were about 9 per cent lower than last year, but relative to the three-year baseline, the report found no substantial progress. Between 2018 and 2020, PM2.5 levels had declined steadily, partly because of the pandemic’s effect on mobility and industry. From 2021–22 onwards, however, annual averages have stagnated at high levels, and in 2024 the annual average climbed sharply to 104.7 µg/m³, reversing earlier gains.
In response, the report urges a suite of structural reforms: accelerated electrification targets, phasing out older vehicles, expansion of public transport and last-mile connectivity, and creation of safer walking and cycling networks. It also calls for parking caps, congestion fees, cleaner industrial fuels, lower gas taxes, the elimination of waste burning, better waste segregation and the remediation of legacy dump sites. On Monday, Delhi’s 3 pm AQI was recorded at 303, placing it firmly in the ‘very poor’ band, according to the CPCB’s bulletin.
Advertisement
With PTI inputs
Published At: