China and India have enjoyed significant economic growth in recent years. Between 1990 and 2017, the two countries had an average GDP per capita growth rate of 8.6 per cent and 4.5 per cent, respectively. However, the effects of growth within each country have been different.
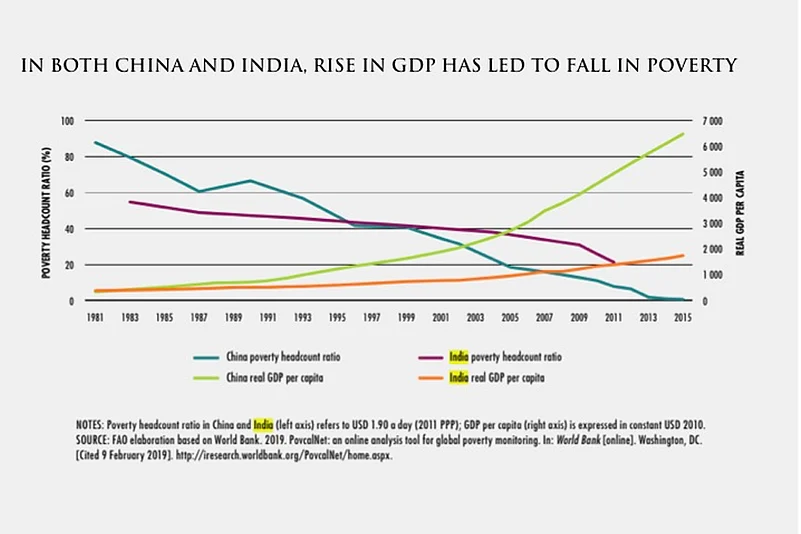
The figure below shows that in both countries the increase in GDP per capita has been accompanied by poverty reduction. China’s poverty rate declined from 88 per cent in 1981 to 0.7 per cent in 2015. In comparison, India’s poverty reduction seems relatively more modest—moving from 48.9 per cent in 1987 to 21.2 per cent in 2011, or to 13.4 per cent in 2015 if another World Bank source is used.
Advertisement
For the period 1999–2005, the income elasticity of poverty in China was estimated at 1.51. This means that a 1 per cent increase in GDP per capita was associated with poverty reduction rates of 1.51 per cent. During the same period, India had an income elasticity of poverty of only 0.4.
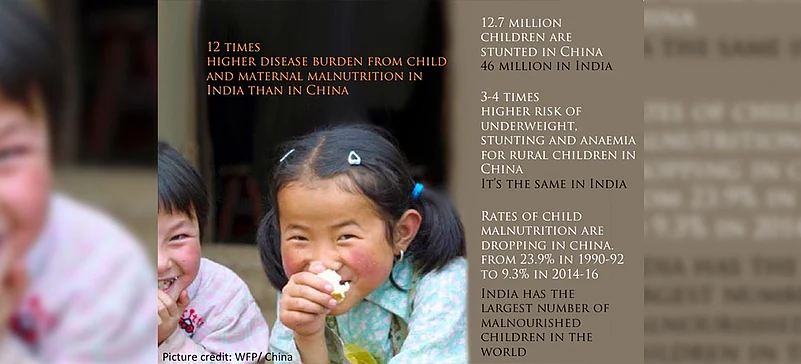
Regarding hunger and malnutrition, the prevalence of undernourishment (PoU) decreased from 15.9 per cent in 2002–2004 to 8.8 per cent in 2015–2017 in China, compared with a decrease from 22.2 per cent in 2002–2004 to 14.8 per cent in 2015–2017 in India.
Stunting in children under five years of age fell from 17.8 per cent in 2000 to 8.1 per cent in 2013 in China. In India, it fell from 54.2 per cent to 38.4 per cent between 2000 and 2015, which is still a high prevalence, compared with a global average of 23.2 per cent in 2015.
Advertisement
The unique growth patterns and inequality levels in each country may help explain the differences observed in the countries in terms of poverty and food security and nutrition trends:
A) The pattern of economic growth in China, especially in the 1980s, shows that the primary sector, where most of the poor derive their livelihoods, was one of the most dynamic sectors behind GDP growth. On the other hand, in India, the rate of growth has been higher in the industrial and services sectors than in agriculture.
B) The responsiveness of poverty reduction to growth is generally higher when initial inequality is lower. This seems to have been the case for income inequality in China, wherein 1983 the Gini coefficient (a statistical measure used as a gauge of economic inequality, measuring income distribution among a population) was 28.3. In India, the Gini coefficient that year was 31.5. At the same time, the land was much more equally allocated in China than in India during the 1980s. Furthermore, the Gini coefficient for urban and rural areas in 1983–84 was 24.7 and 18.5, respectively, in China, compared with 30.0 in urban areas and 33.3 in rural areas in India.
C) Finally, different initial conditions in human development also played an important role. Health and education standards were much better in China in the 1980s than they were in India. In 1980, China had 2.2 hospital beds per 1,000 people compared with 0.8 in India. This number increased to 3.8 in 2011, while it decreased to 0.7 in India. Differences in literacy rates were also important. Only in 2011, India was able to reach the levels of literacy that China had in 1982, amounting to more than 65 per cent.